The Joint Refinement of Inhibitors of Thermolysin |
This chapter will describe preliminary attempts to describe a series of inhibitors jointly, that is the portions of the protein relatively unaffected by binding must be consistent with all the data sets. The goal is to model the greatest number of observations with the fewest parameters.
The results of this work have applications whenever a set of crystals have similar contents. Such sets occur in inhibitor and mutant studies as well as when solving structures using molecular replacement.
A requirement of this work will be the development of means to model the small nonisomorphisms which will be occur from one complex to another. Such a model will be useful in a wide range of applications, from an additional tool in refinement to increase the radius of convergence (a generalization of rigid body refinement) to the optimization of molecular replacement models prior to the solution of the translation function.
The work to be described in this paper has developed out of the continuing project for studying the protease Thermolysin [1]. While Thermolysin is of interest because of its thermostability and its similarity to the angiotensin converting enzyme neither of these matters will be discussed here.
This paper will discuss the consequences of what appeared to be a very simple decision. It was realized that the model of "native" Thermolysin, which was the starting point for all inhibitor refinement, contained a number of errors. These errors included large torsion angle errors in the side chains of about 5% of the residues in the model and the presence of a dipeptide of unknown composition bound in the active site of the enzyme. Since the model had been built and refined prior to 1981 and no interactive computer graphics were available to aid in the interpretation of the maps it is perhaps not surprising that such errors were made. It was decided to recollect the diffraction data for the "native" crystals and refine the model to the current standards for a 1.6Å resolution model.
The additional refinement was completed [2]. The dipeptide was modeled with the sequence val-lys (which is the terminal dipeptide of thermolysin) although there is some evidence in the density map that the contents of the active site are not completely homogenous. The new model contains 185 water molecules (0.6/residue), one DMSO molecule, and 6 side chains with two discrete conformations where the fractional occupancies of each conformation were refined.
The plan was to extract the active site contents of each of the previously refined protein:inhibitor models and place these atoms in the active site of the new "native" model, and remove any atoms in the "native" model which clash with the inhibitor or new solvent atoms. This chimera model was to be the starting model for the updated refinement of the inhibitor.
So much for plans. The first inhibitor complex to be refined was that of the Phosphoramidon inhibitor [3]. The structure of this natural product is Rhamanose-P(O2)-leu-trp. The central phosphoamide group is a mimic of the presumed tetrahedral intermediate of peptide cleavage. While the crystals diffracted quite well, diffraction data were only collected to 2.3Å as that was the limit of the precession photography method used to collect the data. This inhibitor was chosen as a test case for nostalgic reasons and as a limiting case -- it and the other precession data inhibitors having the lowest resolution data sets of any of the Thermolysin inhibitors solved so far.
When this inhibitor was refined using the new "native" model as a base the R-value dropped quite low (12 to 13%) but many of the water molecules did not remain near their original locations and the occupancies of the statically disordered side chains were quite misbehaved. The problem with the occupancies is expected for this resolution and they can easily be fixed at the "native" values. The problem with the wandering solvent is more difficult to solve. This is because the solvent merely exhibit more seriously a general short-coming of the refinement.
A comparison of the new "native" and the refined thermolysin:phosphorhamadon models shows that many atoms through out the protein have been shifted by varying amounts. Since the protein does not appear to change overall conformation, outside the vicinity near the active site, one would not expect such alterations to reflect anything other than the greater imprecision of the lower resolution data set. The low resolution inhibitor model contains errors which can be identified as such by using the high resolution data of the "native" crystal but this high resolution information is not included in the refinement residual.
The traditional means for handling this situation is to impose a "similarity" restraint. The low resolution model is exposed to the additional restraint that the atoms distant from the active site should be near the location of their mates in the high resolution model.
There are two major problems with this approach. The first is that similarity restraints, as usually implemented, do not allow much flexibility -- literally. If there are cell constant changes or alterations in the orientation of domains upon binding of the inhibitor it is not proper to impose the similarity. While this problem is purely an implementation choice and could be generalized the second problem is more fundamental. The similarity restraint does not embody the basic symmetry of the situation.
Suppose we have a dozen protein:inhibitor data sets we wish to refine. In each case the constant protein part will be restrained to the protein part of the "standard" model. In the end there will be a dozen models each restrained to their own diffraction data set and the conformation of the standard but there will be no information passing from one inhibitor to another -- Even though there are eleven more versions of the protein part to consider. The waste is most evident when the protein:inhibitor crystals diffract as well the "native" and it especially clear when the "native" is really simply another protien:inhibitor complex.
One would like a method where the high resolution data from each complex crystal would affect the refinement of all the other complexes.
It is even useful for the data of the lower resolution crystals to be used in the higher resolution refinements. In the case of thermolysin, the lower resolution data sets were collected with the precession film method and one would expect the precision of these data to be better than the lower resolution part of the high resolution oscillation film data sets because of their higher redundancy. In general, as long as the model can handle it, it is always better to use data than to exclude it.
One cannot build this symmetry into the similarity restraints. One could attempt it by building in all the cross-similarities between all the protein parts of the complexes but some sort of weighting would have to be used to adjust for the differing resolutions of the models. This weighting would be very complicated as it would have to account for the resolution, quality, and completeness of each data set. My rule of thumb is "When the weighting gets tough you are using the wrong approach".
There are two major problems which must be solved when beginning a joint refinement. Firstly the boundary between the constant and variable regions must be established and secondly the nonisomorphism of the constant region -- as it is substituted into each protein:inhibitor crystal -- must be modeled. The two problems are connected in that the boundary between the constant and variable regions will depend upon the quality of the nonisomorphism correction.
While the correction for nonisomorphism is the most difficult part of the joint refinement model to construct it is also quite interesting. Usually protein:inhibitor complexes are refined as independent problems. The result is two sets of coordinates which exhibit a background of variability. It is not easy to examine the two coordinate sets to determine which shifts are significant and which are not. The modeling of nonisomorphism in joint refinement encourages the construction of a model of these differences which requires the fewest parameters. These parameters can be refined with great precision while at the same time the model is simply not allowed to vary in ways which do not make any improvement in the fit to the observations.
On the other hand, the model of the nonisomorphism is the greatest weakness of joint refinement. It may simply be impossible to generate a model with fewer than a new set of atoms for each new crystal added to the refinement. The existence of a nonisomorphism model cannot be determined from basic principles. One must try to construct a model and decide if the result sufficiently explains the observations.
The overall strategy of joint refinement is:
Since the number of parameters in a joint refinement is so much smaller that the set of individual refinements one would expect that the joint model would agree less with the diffraction data. We should not expect the R-values to be as low as those achieved before.
The third class of parameters are of a different type. They are the
parameters of the nonisomorphism and their character will depend on the
model of the nonisomorphism. We cannot know their exact form until we have
defined the model. In general, however, we can describe the nonisomorphism
as a mapping function which takes the general ![]() parameters and produces the expression of these atoms in a particular unit
cell. This mapping function will be called
parameters and produces the expression of these atoms in a particular unit
cell. This mapping function will be called ![]() .
There will be a different mapping function for each crystal j.
.
There will be a different mapping function for each crystal j.
Once the atoms of the constant region have been transformed by the mapping function they can be added to the atoms of the variable region for that crystal and the resulting coordinate set can be used for the evaluation of the R-value, standard geometry agreement, and refinement gradient calculation just like a normal coordinate set.
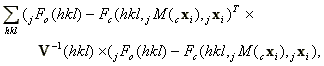
To analyze the refinement of a model of this nature let us start with the crystallographic residual. For each crystal the residual is
To complete the residual one must combine the contributions of all the crystals. One is tempted to simply sum the individual residuals to get the equation
This is not correct.
The problem is that the residuals -- (Fo - Fc) -- for each reflection across all the different crystals are not independent. In effect each additional crystal does not provide an amount of information equivalent to that of the first crystal. In the extreme case, if the second crystal provided residuals which were equal to those of the first no new information would be added by considering it.
We will make the simplifying assumption that the residual for one reflection is independent of the residuals of all the reflections with differing hklís. However for a given hkl the residuals from all the crystals are correlated with each other to some extent. Given this assumption the form of the total residual is
 (1)
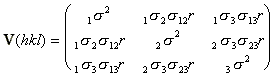
(1)where ![]() is
now a j x j covariance matrix (Generally the square root of the variance
is defined to be the standard deviation, . Least-squares is usually defined
in terms of standard deviations even though the math is more direct when
expressed in variances.) The diagonal of
is
now a j x j covariance matrix (Generally the square root of the variance
is defined to be the standard deviation, . Least-squares is usually defined
in terms of standard deviations even though the math is more direct when
expressed in variances.) The diagonal of ![]() contains the variance of the reflection in each crystal while the off-diagonal
elements are the products of the standard deviation of each crystal times
their correlation coefficient. For a three crystal joint refinement the
variance matrix for a particular reflection would be
contains the variance of the reflection in each crystal while the off-diagonal
elements are the products of the standard deviation of each crystal times
their correlation coefficient. For a three crystal joint refinement the
variance matrix for a particular reflection would be
 ,
,where ![]() is the standard deviation of the reflection measured in the ith crystal
and
is the standard deviation of the reflection measured in the ith crystal
and ![]() is
the correlation coefficient between the reflection in crystal i and that
in crystal j.
is
the correlation coefficient between the reflection in crystal i and that
in crystal j.
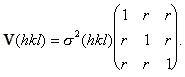
In practice it is difficult to estimate the individual standard deviations for observed reflections and it is much harder to estimate all the correlation coefficients. It is much simpler to assume the standard deviation is the same for all crystals and the correlation coefficients are equal as well. This simplification results in the variance matrix
The resulting variance matrix will depend upon the correlation coefficient and the number of crystals in the joint refinement. This relationship is shown in Figure 1.
As can be seen, when the residuals from the crystals are uncorrelated the least-squares sum simply expands to a sum over the crystals. The contribution of a reflection is the number of crystals. As the residuals become more correlated the contribution to the least-squares residual drops until, in the limit of a coefficient of one, the contribution of a reflection is independent of the number of crystals.
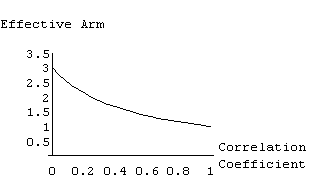
This relationship is simply a generalization of the notion of "counting statistics". When you have N independent measurements the variance of the mean is 1/N that of a single measurement. If the N measurements are not independent but correlated with a coefficient of one there is, in effect, only one measurement and the variance of the mean is equal to that of a single measurement. Figure 1 shows all the values between.
Implementing joint refinement in this fashion would be very costly, both in programmers' time and execution time. The project would require very different code than that existing in TNT [4], the package of choice for this investigator. In addition, computational optimizations such as the real-space calculation of function gradients [5] would not be possible.
For the purpose of testing the viability and utility of joint refinement several approximations were made to produce a simpler implementation. The joint model consists of a coordinate set containing atoms from the common portion and atoms from each inhibitor. During refinement this coordinate file is expanded ("scattered" in TNT nomenclature) to a separate, complete, coordinate file for each crystal. The least-squares residual function, along with its first derivatives and diagonal elements of the second derivatives are calculated for each crystal. These derivatives are then collapsed ("gathered") back into the smaller parameter set by the application of the appropriate transformation for each crystal to the common portion and summing the derivatives.
This implementation is proper only if the residuals are completely uncorrelated. If the residuals are strongly correlated the gradient will be overestimated by a factor of the number of crystals. The diagonal element of the second derivative will, likewise, be overestimated by the same factor. Since the refinement shift is calculated from the ratio of the two the error cancels.
The cancellation of errors is only approximate because the gradient used to calculate the refinement shift is the sum of the crystallographic term and the stereochemical term and the second derivative is also such a sum. Because the stereochemical validity of the model is determined separately for each crystal the derivatives of this term is overestimated by a factor of the number of crystals as well. When the residuals are highly correlated the current method works properly. If the residuals are uncorrelated this method will not properly balance the crystallographic and stereochemical derivatives. A comparison of the final refined Fo-Fc maps shows that the correlation coefficients of the residuals for these inhibitors are on the order of 0.6.
There is an additional difficulty. Usually the data set from any crystal is not complete. Even though a joint refinement might have six crystals some reflections might have only been measured five, four, or even fewer times. When this problem occurs the errors in the crystallographic derivatives and those in the stereochemical derivatives will not cancel. With the current implementation one must be careful to ensure that the areas of reciprocal space covered by the data collection are highly congruent. This limitation results in the requirement that the resolution limits of the crystalsí data sets be the same. The original problem of refining a low resolution model jointly with a high resolution one cannot be solved with this implementation but the difficult problem of modeling nonisomorphism can be investigated.
The inhibitors are named ZGPLL, ZGPoLL, ZFPLA, and ZFPoLA [6][7][8].
They can be ordered as a pair of pairs. ZGPLL has the sequence Cbz-Gly-Leu-Leu
where the C=O of the peptide bond between the glycine and leucine has been
replaced with a ![]() group to mimic the transition state of the peptide bond cleavage. ZFPLA
differs only in that the glycine has been replaced by phenoalinine and
the terminal leucine by alanine. In the inhibitors whose names contain
the lower-case "o" the amide nitrogen of the central leucine has been replaced
with an oxygen.
group to mimic the transition state of the peptide bond cleavage. ZFPLA
differs only in that the glycine has been replaced by phenoalinine and
the terminal leucine by alanine. In the inhibitors whose names contain
the lower-case "o" the amide nitrogen of the central leucine has been replaced
with an oxygen.
When the structures of these complexes were originally solved it was observed that the conformations of each amide-ester pair were nearly identical but the ZG part binds in a very different conformation from the ZF part of the other inhibitors. This difference in binding caused a small change in the location of a near by strand of the protein. While all of the atoms of the protein far from the active site differ in location from one inhibitor to another these differences were small and were considered insignificant.
The test of joint refinement was began by constructing a standard starting model for each crystal. This model contained the new model for "native" and the model of the inhibitor and associated water molecules from the best refinement performed prior to this test. Any water molecules from the "native" model which clashed with the inhibitor were deleted. No attempt was made to manually move any atoms.
For each complex this model was refined in the usual way, 20 cycles with the TNT refinement package [4]. The resolution limit of the diffraction data were 1.7Å, the B factors were allowed to vary without stereochemical restraint, and the group occupancies of the disordered side chains and the inhibitors themselves were allowed to vary. For simplicity's sake, no manual evaluations of the resulting models were made. The R-values of the resulting models are given in the first column of Table 1.
The first test of joint refinement was made with no attempt to model nonisomorphism. Three refinement runs were performed. The inhibitors were jointed pair wise and then all together. To allow for the adjustment of the protein due to inhibitor binding residues 111 through 119, 143, and the zinc atom were modeled with separate copies for each crystal, along with the inhibitor itself and the associated water molecules. In ZGPLL and ZGPoLL an additional DMSO molecule binds near the inhibitor and this molecule was treated as inhibitor associated solvent.
A number of details must be considered when performing this refinement. The most important is that the overall B factor of all but one of the crystals in a refinement must be allowed to vary. In general one should also allow for varying the over-all anisotropic B factor but this was not done in the case because the diffraction decayed very similarly in all cases.
Initially the crystals were refined pair wise. This seemed to be the
most ideal arrangement because the two "ZG" inhibitors and the two "ZF"
inhibitors are very similar to one another. The R-values in Table 1 show
that the resulting model for the "ZG" inhibitors generates agreement with
the individual diffraction data sets almost as well as the individual models.
The "ZF" models lose about four tenths of a percent of R-value in each
case, which is slightly worst than the "ZG" joint refinement.
|
|
|
|
|
|
|
|
|
|
|
|
|
|
|
|
|
|
|
|
The agreement of the resulting models with the diffraction data shows a small decrease in the quality of the fit when the "ZG" variants are jointed and again a small decrease with the joined "ZF" variants but a large drop in quality when all four are joined. This pattern implies that the two types of inhibitors are in some sense incompatible.
The decrease in the fit of the models to the data could arise from the large decrease in the number of parameters. The models for four crystals refined independently contain about 40,000 parameters which are defined by refining against about 100,000 diffraction intensities. The four-fold joint model, however, contains only about 10,000 parameters. One might expect the R-values to rise for this reason alone. Of course the R-value may be rising because of a failure to model the nonisomophism. If this is the case the model should be updated.
The only way to be sure which possibility is the cause is to examine the joint model against the difference maps and compare the individual models. One expects an atom in the joint model will lie in the center of the distribution formed by the corresponding atoms from the individual models. The significance of the breadth of the distribution is judged based on the size of the difference map features.
Such an examination shows a number of regions where it appears that strands of polypeptide chain are displaced relative to one another. Apparently there are small changes in the location and orientation of each domain. To model this motion it was chosen to allow the two domains to move as rigid bodies from one inhibitor to another.
The thermolysin molecule consists of two domains. Residues 1 through
125 form the N-terminal domain and 126 to 316 form the C-terminal domain.
The water molecules, and metal ions were each associated with the domain
they lay closest to. The rigid-body shifts of these domains were determined
by comparing the orientation of the domains in the "native" model with
each individually refined protein:inhibitor model.
| TLN:ZGPLL | 15.2 | 15.3 | 15.9 |
| TLN:ZGPoLL | 15.2 | 15.4 | 16.0 |
| TLN:ZFPLA | 15.3 | 15.6 | 15.8 |
| TLN:ZFPoLA | 16.2 | 16.4 | 17.0 |
The increase in R-value upon imposing a two-fold joint refinement is slightly better than before but the table shows great improvement for the four-fold joint refinement. Where before the R-values increased by 1.1 to 1.8% the increase is now only ranges from 0.5 to 0.8%.
This result implies that there is a significant rigid-body shift of the two domains of thermolysin upon binding of some inhibitors. Although the shift does occur and is present in the previously refined models it was never recognized because of its small size. These shifts were simply considered part of the "background" shifts of the individual atoms in the model.
When these models are examined it is apparent that some bulk shifts of regions of each domain are still unmodeled. Since these regions appear to be near the crystal contacts the possibility that the cell constants of each crystal differ was investigated.
Joint refinement should be sensitive to differences in cell length from one inhibitor to another. If the cell lengths are defined to be equal for all crystals one will observe that the contents of one crystal might shrink and other swell. These changes cannot be accommodated using the rigid body motions of the refinements reported in Table 2.
To test for this possibility a more generalized noncrystallographic symmetry transformation was developed. Instead of insisting that the matrix applied to the coordinates be a rotation matrix a general matrix was allowed. Such a matrix introduces a resizing of the domain as well as a rotation. While this model can accommodate cell constant changes it is much more general and will correct for other types of differences between the two models. If this model of nonisomorphism fails to improve the fit of the joint model cell constant errors are not significant, but if this model is successful the cause might not be due to the modeling of cell constant errors.
The refinement programs were modified to relax the constraints on the ncs symmetry operators. The transformations were again derived by comparing the "native" model with the individually refined models of the protein:inhibitor complexes and the joint refinements were processed again. The changes in the final R-values are listed in Table 3.
As seen in the table the R-values did not drop significantly. This implies
that errors in the measurement of the cell constants are not important
determinates of the results of a joint refinement.
| TLN:ZGPLL |
|
|
|
| TLN:ZGPoLL |
|
|
|
| TLN:ZFPLA |
|
|
|
| TLN:ZFPoLA |
|
|
|
Quadratic transformations are third order tensors which are vector multiplied by the position vector of an atom to generate a rotation matrix which is again multiplied by the position vector to generate the new location of the atom. They are difficult to express in vector-matrix notation -- I will use a boldface capital letter with a dot over it to represent these quantities.
The expression for a quadratic transformation is
![]() is a 3x3x3 symmetric tensor
and therefore contains 18 unique elements. A model for nonisomorphism such
as this will require 24 parameters for each domain.
is a 3x3x3 symmetric tensor
and therefore contains 18 unique elements. A model for nonisomorphism such
as this will require 24 parameters for each domain.
The implementation of this model is being constructed.
With a suitable model for the nonisomorphism the quality of the fit should improve. It does not appear unreasonable to expect that one could construct a joint model which agrees with the observations from each crystal as well as a model constructed specifically for that crystal.
[2] D. R. Holland, D. E. Tronrud, H. W. Pley, K. M. Flaherty, W. Stark, J. N. Jansonius, D. B. McKay, and B. W. Matthews, "Structural comparison Suggests That Thermolysin and Related Neutral Proteases Undergo Hinge-Bending Motion during Catalysis," Biochemistry, Vol. 31, No. 46, pp. 11310-11316, 1992.
[3] L. H. Weaver, W. R. Kester, and B. W. Matthews, "A Crystallographic Study of the Complex of Phosphoramidon with Thermolysin. A Model for the Presumed Catalytic Transition State and for the Binding of Extended Substrates," J. Mol. Biol., Vol. 114, pp 119-132, 1977.
[4] D. E. Tronrud, L. F. Ten Eyck, and B. W. Matthews, "An Efficient General-Purpose Least-Squares Refinement Program for Macromolecular Structures," Acta Cryst., Vol. A43, pp 489-501, 1987.
[5] R. C. Agarwal, "A New Least-Squares Technique Based on the Fast Fourier Transform Algorithm," Acta Cryst., Vol. A34, pp 791-809, 1978.
[6] D. E. Tronrud, H. M. Holden, and B. W. Matthews, "Structures of Two Thermolysin-Inhibitor Complexes That Differ by a Single Hydrogen Bond," Science, Vol. 235, pp 571-574, 1987.
[7] H. M. Holden, D. E. Tronrud, A. F. Monzingo, L. H. Weaver, and B. W. Matthews, "Slow- and Fast-Binding Inhibitors of Thermolysin Display Different Modes of Binding: Crystallographic Analysis of Extended Phosphonamidate Transition-State Analogues," Biochemistry, Vol. 26, pp 8542-8553, 1987.
[8] Unpublished results. The structure of ZFPoLA.
[9] M. G. Rossmann, "Processing Oscillation Diffraction Data for Very Large Unit Cells with and Automatic Convolution Technique and Profile Fitting," J. Appl. Crystallogr., Vol. 12, pp. 225-238, 1979.
[10] M. F. Schmid, L. H. Weaver, M. A. Holmes, M. G. Gr¸tter, D. H. Ohlendorf, R. A. Reynolds, S. J. Remington, and B. W. Matthews, "An Oscillation Data Collection System for High-Resolution Protein Crystallography," Acta Cryst., Vol. A37, pp 701-710, 1981.
[11] R. Diamond, "On the Comparison of Conformations Using Linear and Quadratic Transformations," Acta Cryst., Vol. A32, pp 1-10, 1976.